Use Salesforce Reporting with Blackthorn to create custom reports in your Salesforce environment. This tool integrates with standard Salesforce functions, allowing you to analyze Attendee data, Event registrations, Donations and more. Gather clear insights into your Event metrics, enhancing your data-driven decision-making.
The information you need is readily available. You can quickly create reports from an Events record or access existing reports in the Blackthorn | Events Reports folder on the Reports tab.
Use Cases
Admissions Event Analysis
A university hosts admissions Events to engage prospective students. Leveraging Blackthorn's Quick Action Buttons, admissions officers can swiftly access the "Attendees Report," gaining valuable insights into Attendee demographics and engagement levels.
Personalized Event Invites
When using the AttendeeLink to send Event invitations, each Attendee has their own personal link to register for the Event. This means their basic information like their Attendee Full Name, Email, Contact, Phone and more will be prefilled, making registration a breeze!
Financial Analysis for Fundraising Galas
Hosting fundraising galas to support scholarships, the university utilizes the "Financials Report" quick action to obtain a comprehensive financial overview. This report aids in tracking donations, expenses, and overall Event profitability, empowering the fundraising team to strategize for future initiatives and enhance donor relationships.
Types of Reports
The following reports are included when installing the Events package.
Per-Event Reports (Launched from an Event Record)
-
Report Name: "Attendee Summary - Per Event"
- Creates a list of Attendees for an Event
- Enabled for both Lightning and Classic
- Button: Attendees Report
-
Report Name: "Attendees With and Without Seats"
- Shows Attendees with/without Seat assignments and Table information
- Button: Attendee Seat Report
-
Report Name: "Budget & Expense - Per Event"
- Reviews the Budget & Expense summaries for an Event
- Button: Budget & Expense Report
-
Report Name: "Event Invoice Report - Per Event"
- Displays paid and unpaid Invoice details for an Event
- Button: Event Invoice Report
-
Report Name: "Expense Entries - Per Event"
- Shows all Expense Entries for a specific Event
- Button: Budget & Expense Report
-
Report Name: "Financials - Per Event"
- Shows the Financials for an Event
- Enabled for both Classic and Lightning
- Button: Financials Report
-
Report Name: "Form Answers Report"
- Turn Event, Session, and Event Item survey answers into usable data.
- Button: Form Answers Report
Organization-wide Reports (All Events)
-
Report Name: "1) Attendee Summary - All Events"
- Presents a comprehensive Attendee summary across all Events in an org
-
Report Name: "2) Events in the Next 7 Days"
- Shows upcoming Events and their details for the next week
-
Report Name: "3) Attendance Summary - All Events"
- Displays registration and attendance status summary for all Events
-
Report Name: "3) Attendance Summary by Week"
- Shows registration and attendance status summary filtered to the current week
-
Report Name: "4) FY Financial Report - All Events"
- Displays financial performance across all Events for the current fiscal year
-
Report Name: "5) Budget & Expense Summary - All Events"
- Shows Budget & Expense summaries across all Events in an org
-
Report Name: "6) Expense Entries - All"
- Displays all Expense Entry records in an org
Dashboard/Analytics Reports
-
Report Name: "Active Events - This Week"
- Displays Events that are active this week, grouped by free or paid
-
Report Name: "Declined Attendees by Month"
- Lists Attendees who have declined by month
-
Report Name: "Event Invoices By Month"
- Lists paid and unpaid Invoices for each month by Event
-
Report Name: "Invited Attendees by Month"
- Displays Attendees invited by month
-
Report Name: "Registered Attendees by Month"
- Displays registered Attendees by month
Special Purpose Report
- Report Name: "New Attendees with Event Report"
- This report is for the Attendee tab on the Event page layout.
Create a Report from an Event Record
Save time and create one of the six out-of-the-box reports from an Event record by clicking the corresponding button.
Add Buttons to the Event Page Layout
| Report Name | Button |
|---|---|
| Attendee Summary - Per Event | Attendees Report |
| Attendees With and Without Seats | Attendee Seat Report |
| Budget & Expense – Per Event | Budget & Expense Report |
| Event Invoice Report - Per Event | Event Invoice Report |
| Expense Entries - Per Event | Expense Entries Report |
| Financials - Per Event | Financials Report |
| Form Answers Report | Form Answers Report |
- Go to Setup.
- Click the Object Manager tab.
- In the Quick Find box, enter and click “Events” (conference360__Event__c).
- Click the Page Layouts tab.
- Select the layout you want to update.
- Click the Mobile & Lightning Actions tab in the Event Layout navigation.
- Search for each of the following buttons and drag and drop them into the “Salesforce Mobile and Lightning Experience Actions” section.
- Attendees Report
- Attendee Seat Report
- Budget & Expense Report
- Event Invoice Report
- Budget & Expense Report
- Financials Report
- Form Answers Report
- Click Save.
Create a Report
- Open an Event record.
- Click the More tab to see the buttons.
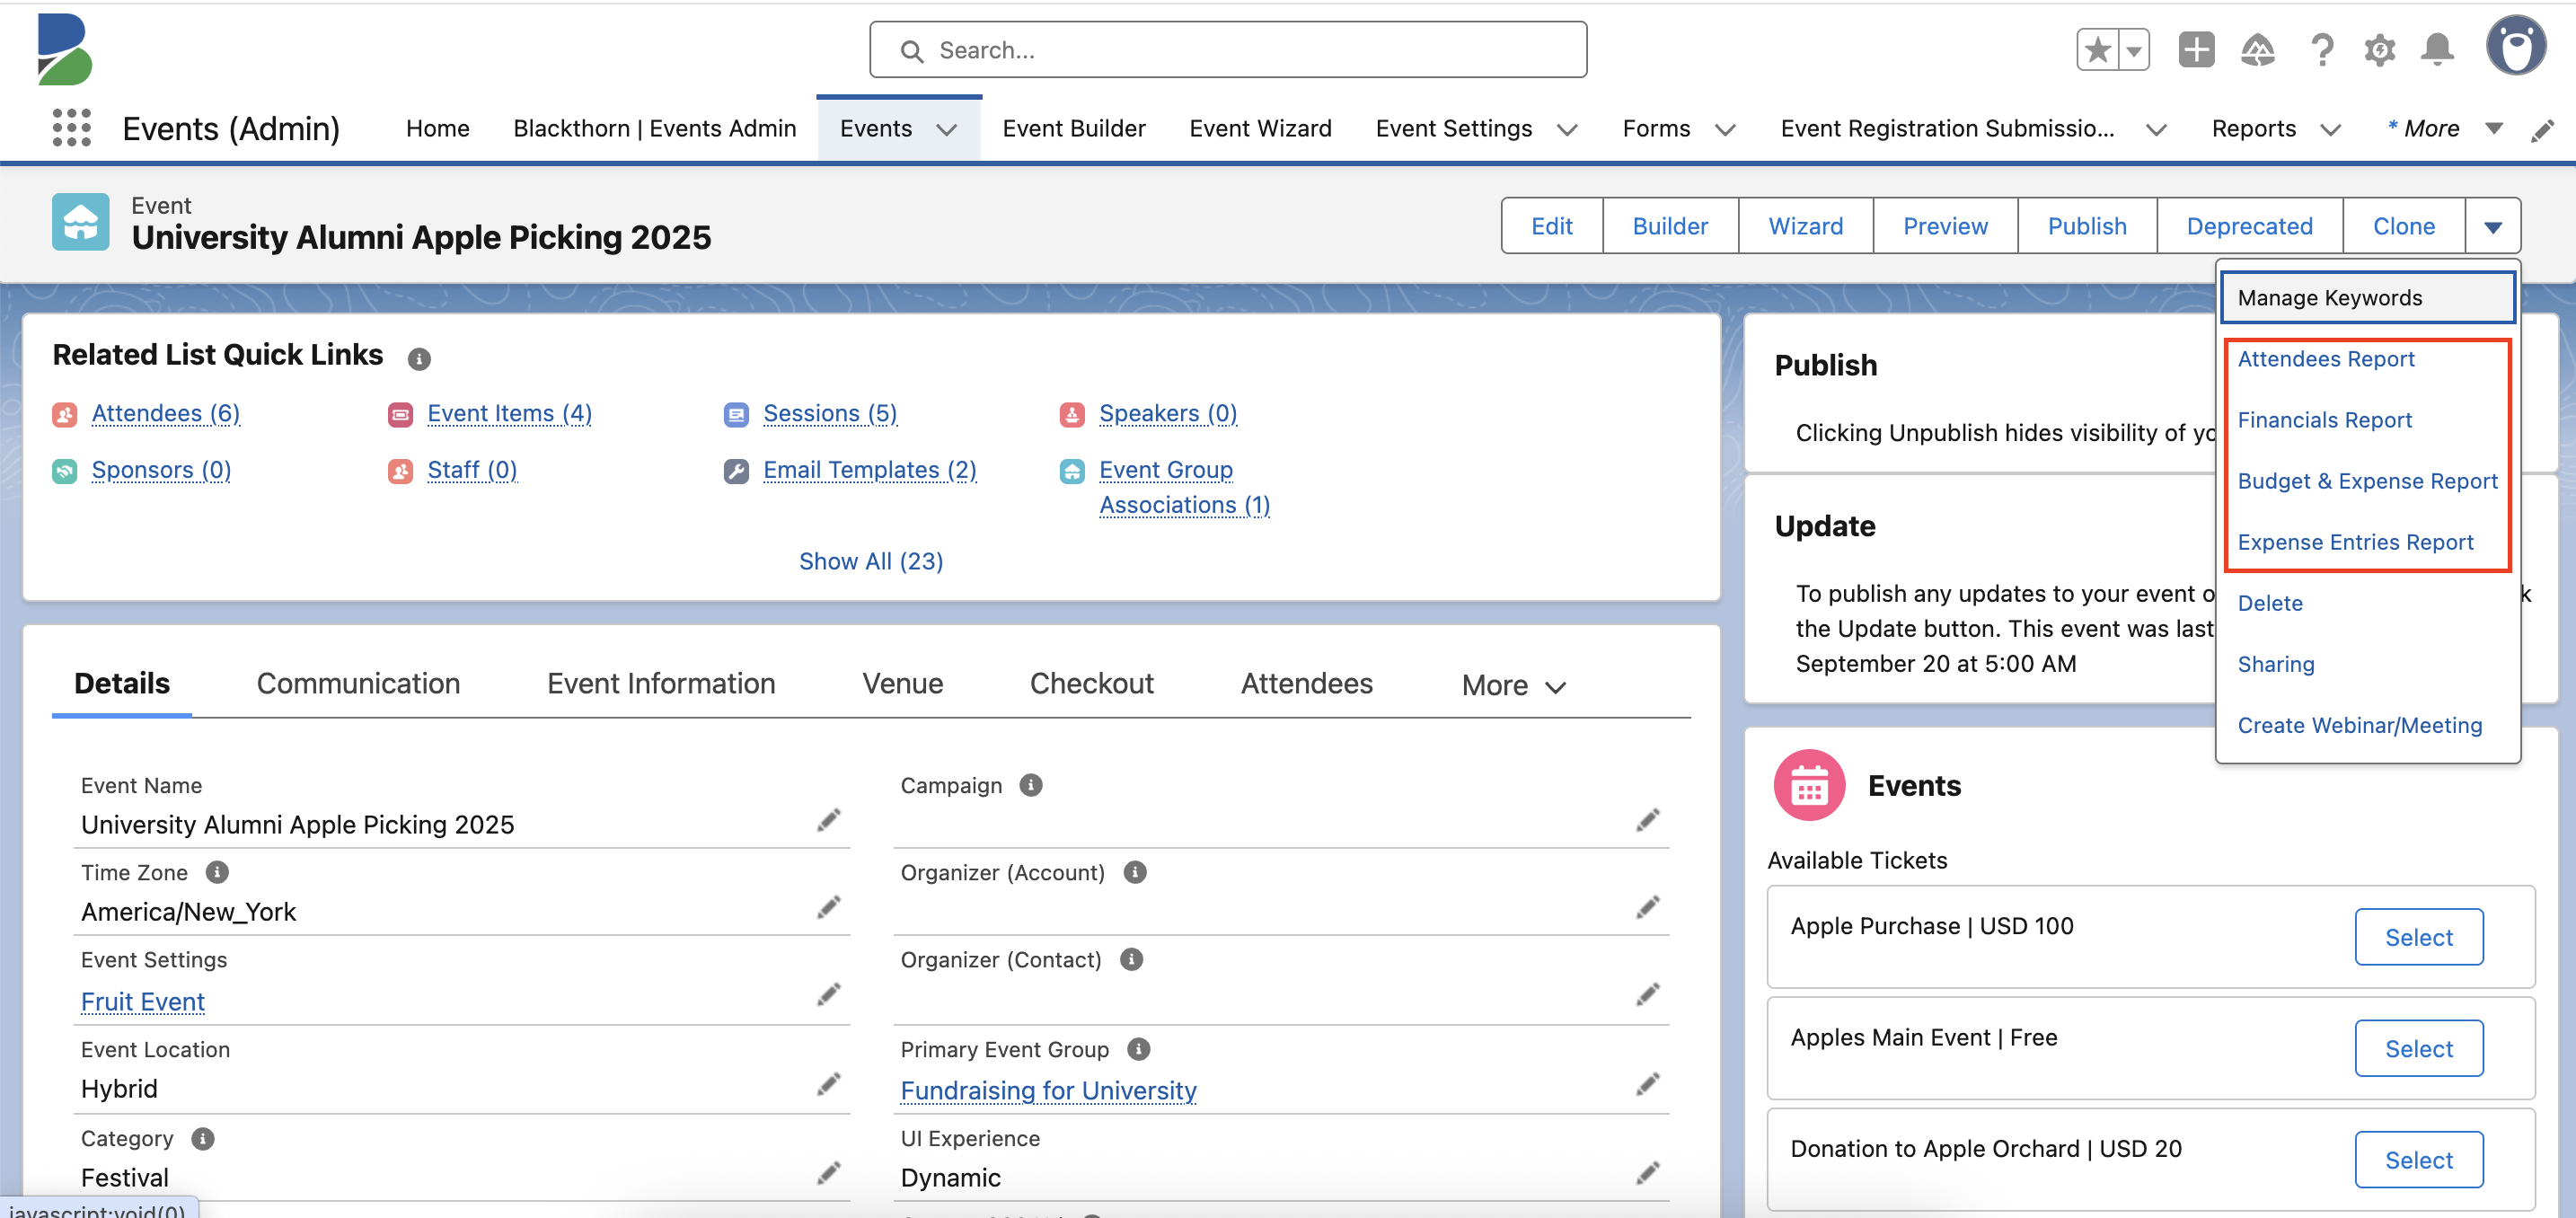
- Click the corresponding button for the report you would like to create.
- From here, you can filter the results and save, subscribe to, or export the report.
When a user imports a report with Accounts and Contacts from the Attendee tab on an Event, only the first 2000 rows/Attendees will be added to the Event. Since Salesforce has a limit of 2000 rows, you must use a Data Loader to import more than 2000 Attendees.
Working with All Other Reports
Complete the following steps to access the other reports.
- Click the App Launcher.
- In the Quick Find box, enter and click “Reports.”
- Click the All Folders tab.
- Click the “Blackthorn | Events Reports” tab.
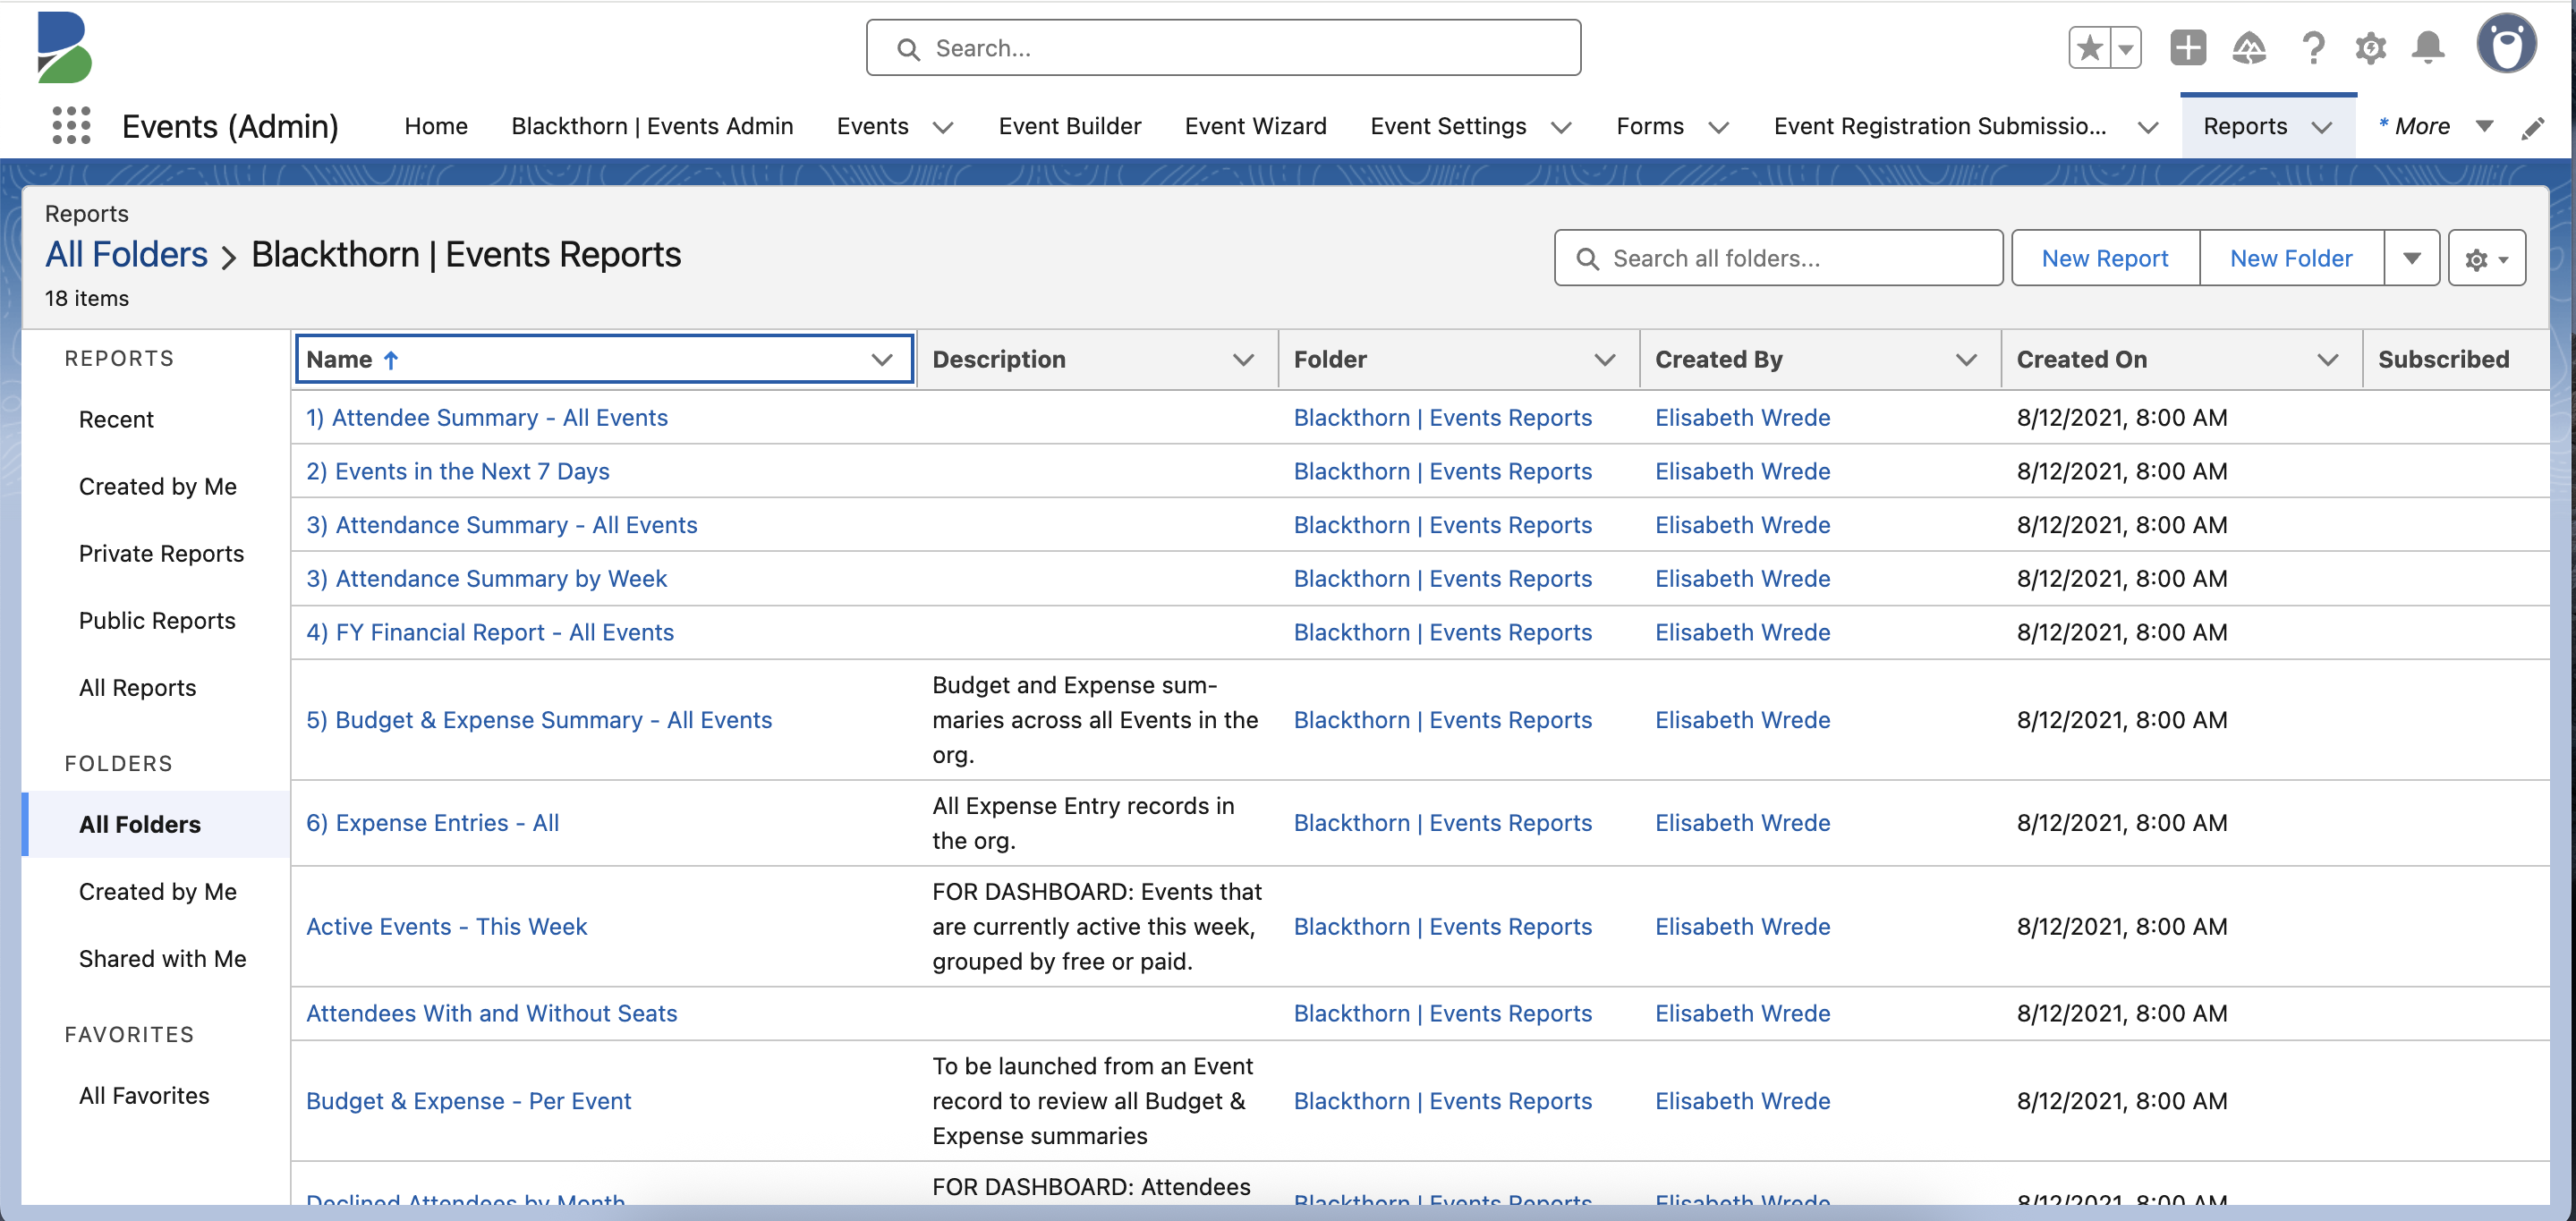
- Click the name of the report.
- From here, you can perform the following tasks:
- enable field editing
- add filters
- refresh, edit, save, subscribe to, export, and delete the report
- add the report to the dashboard